Makepad Flow
A visual dataflow graph library and viewer built with Makepad. Create, visualize, and interact with node-based dataflow graphs.
Features
- FlowCanvas Widget: GPU-accelerated canvas for rendering node graphs
- Interactive Editing: Drag nodes, create connections, zoom and pan
- Customizable Nodes: Multiple shapes (rounded, diamond, circle), colors by category
- Edge Styling: Solid, dashed, dotted lines with animated flow particles
- YAML Import: Load dataflow definitions from YAML files
- Filtering: Search, category filters, enable/disable nodes and ports
Quick Start
Renderings
Project Structure
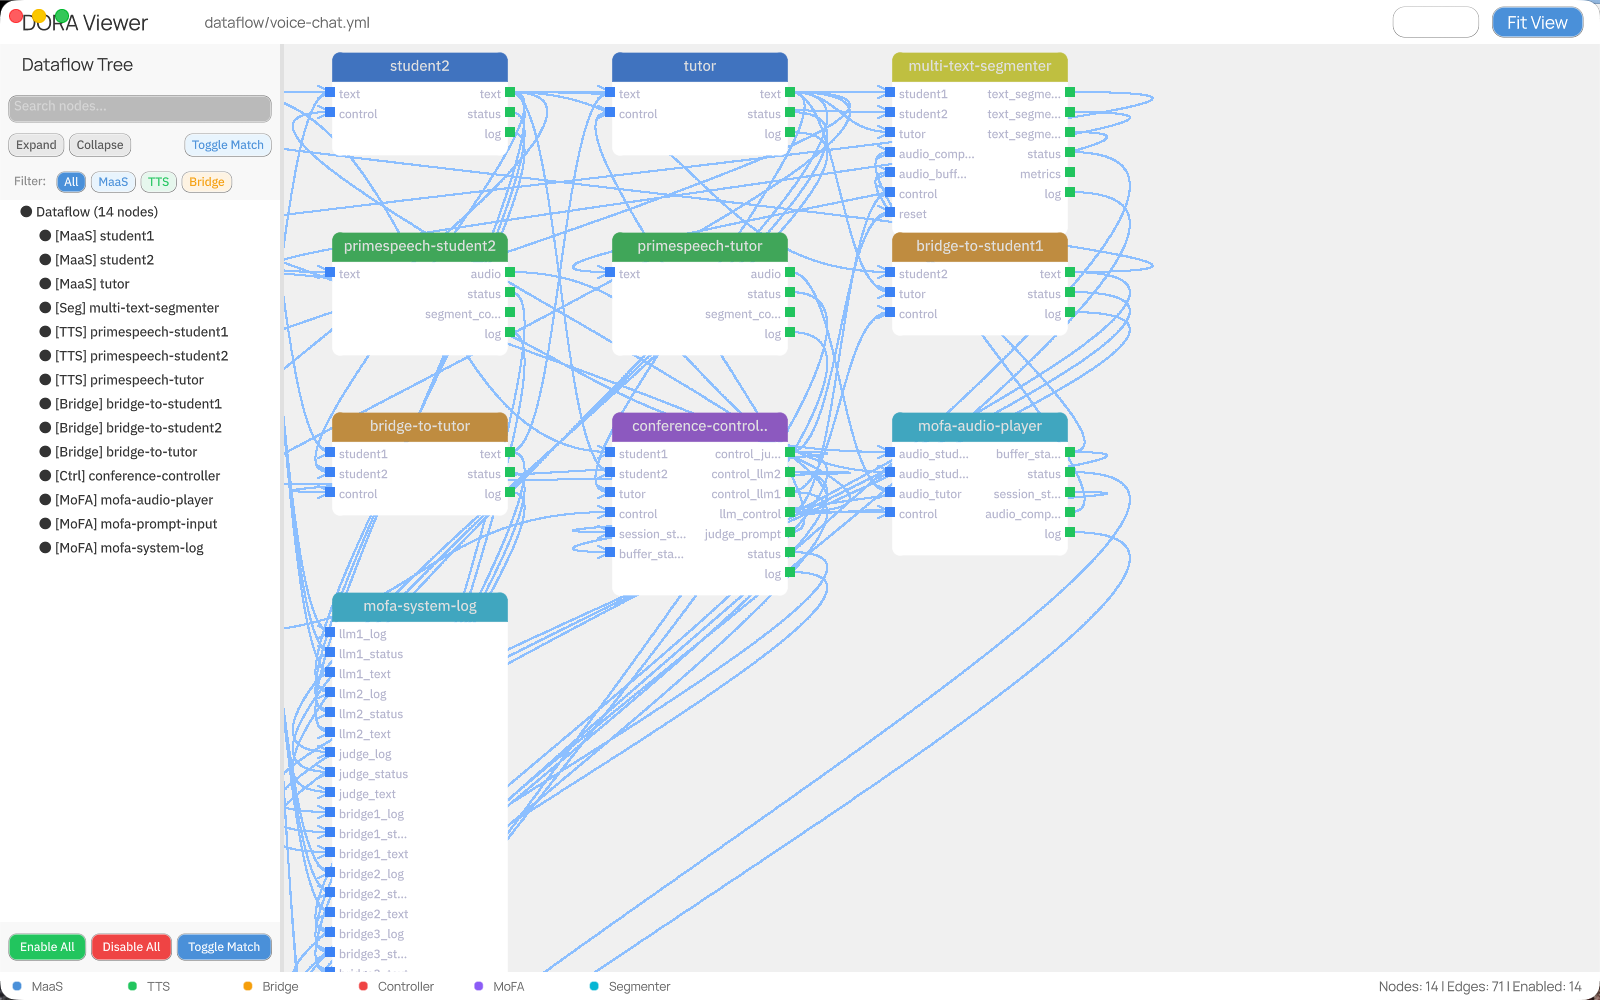
DORA Viewer
The DORA Viewer is a complete application for visualizing DORA dataflow definitions.
Running
Features
| Feature | Description |
|---|---|
| Load YAML | Automatically loads dataflow/voice-chat.yml |
| Pan & Zoom | Mouse wheel to zoom, drag empty space to pan |
| Select Nodes | Click to select, drag to multi-select |
| Move Nodes | Drag selected nodes to reposition |
| Filter by Category | Click MaaS, TTS, Bridge buttons |
| Search Ports | Type in search box to filter |
| Toggle Match | Batch enable/disable ports matching search |
| Ctrl+Click | Toggle individual node/port enabled state |
Canvas Navigation
| Action | How To |
|---|---|
| Pan/Move Canvas | Shift + Mouse Drag anywhere on canvas |
| Zoom In/Out | Mouse wheel scroll up/down |
| Fit All Nodes | Click "Fit View" button in toolbar |
| Select Node | Click on a node |
| Multi-Select | Click and drag to create a selection box around nodes |
| Move Nodes | Drag selected node(s) to new position |
Enable/Disable System
The viewer supports enabling and disabling nodes and ports to filter the dataflow visualization.
Ctrl+Click to Toggle
In the tree panel on the left, use Ctrl+Click on any item to toggle its enabled state:
- Ctrl+Click on a Node: Toggles the node AND all its ports
- Ctrl+Click on a Port: Toggles only that specific port
Enable States
| State | Icon | Description |
|---|---|---|
| Fully Enabled | ● | Node and ALL ports are enabled - shown normally on canvas |
| Partially Enabled | ◐ | Node has SOME ports enabled, others disabled - node visible, only enabled connections shown |
| Fully Disabled | ○ | Node and ALL ports are disabled - node hidden from canvas if no connections remain |
Visual Indicators
- Enabled items: Normal text color in tree
- Disabled items: Dimmed/grayed text in tree
- Hidden connections: Edges to disabled ports are not drawn on canvas
- Hidden nodes: Nodes that lose ALL connections (due to disabled ports) automatically disappear from the canvas
Batch Operations
| Button | Location | Effect |
|---|---|---|
| Enable All | Footer | Enable all nodes and all ports |
| Disable All | Footer | Disable all nodes and all ports |
| Toggle Match | Header & Footer | Toggle all ports matching current search text |
Example Workflow
- Type "control" in search box
- Click Toggle Match → All ports containing "control" are disabled
- Nodes that only had "control" connections disappear from canvas
- Click Toggle Match again → Ports re-enabled, nodes reappear
Controls Summary
| Action | Control |
|---|---|
| Pan canvas | Shift + Mouse Drag |
| Zoom | Mouse wheel |
| Select node | Click node |
| Multi-select | Drag selection box |
| Move nodes | Drag selected node(s) |
| Enable/Disable | Ctrl+Click in tree |
| Node context menu | Right-click node |
| Edge context menu | Right-click edge |
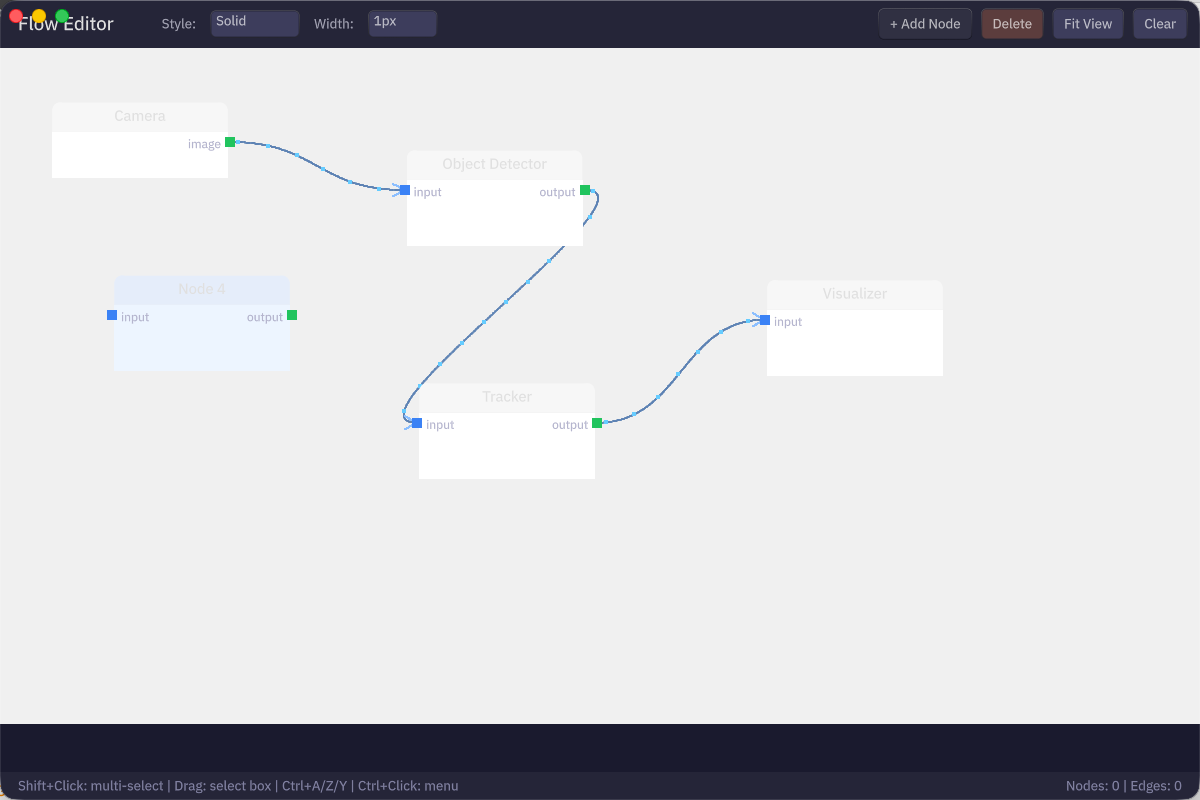
FlowCanvas Library
The core makepad-flow crate provides the FlowCanvas widget for building your own flow-based applications.
Basic Usage
Adding Nodes
Node Categories
Nodes can be assigned categories for color-coding:
| Category | Color | Use Case |
|---|---|---|
| MaaS | Blue | Model as a Service |
| TTS | Green | Text-to-Speech |
| Bridge | Orange | Connectors |
| Controller | Red | Control nodes |
| MoFA | Purple | MoFA agents |
| Segmenter | Cyan | Segmentation |
YAML Dataflow Format
Example
Documentation
- DORA Viewer Usage - Detailed usage guide
- API Gaps - Known limitations
- Roadmap - Future development plans
Requirements
- Rust (latest stable)
- Makepad framework
ON THIS PAGE