Makepad Chart

https://github.com/mofa-org/makepad-chart

GPU-accelerated charting library for Makepad with ~75% Chart.js parity.

Chart Zoo Platform

Features

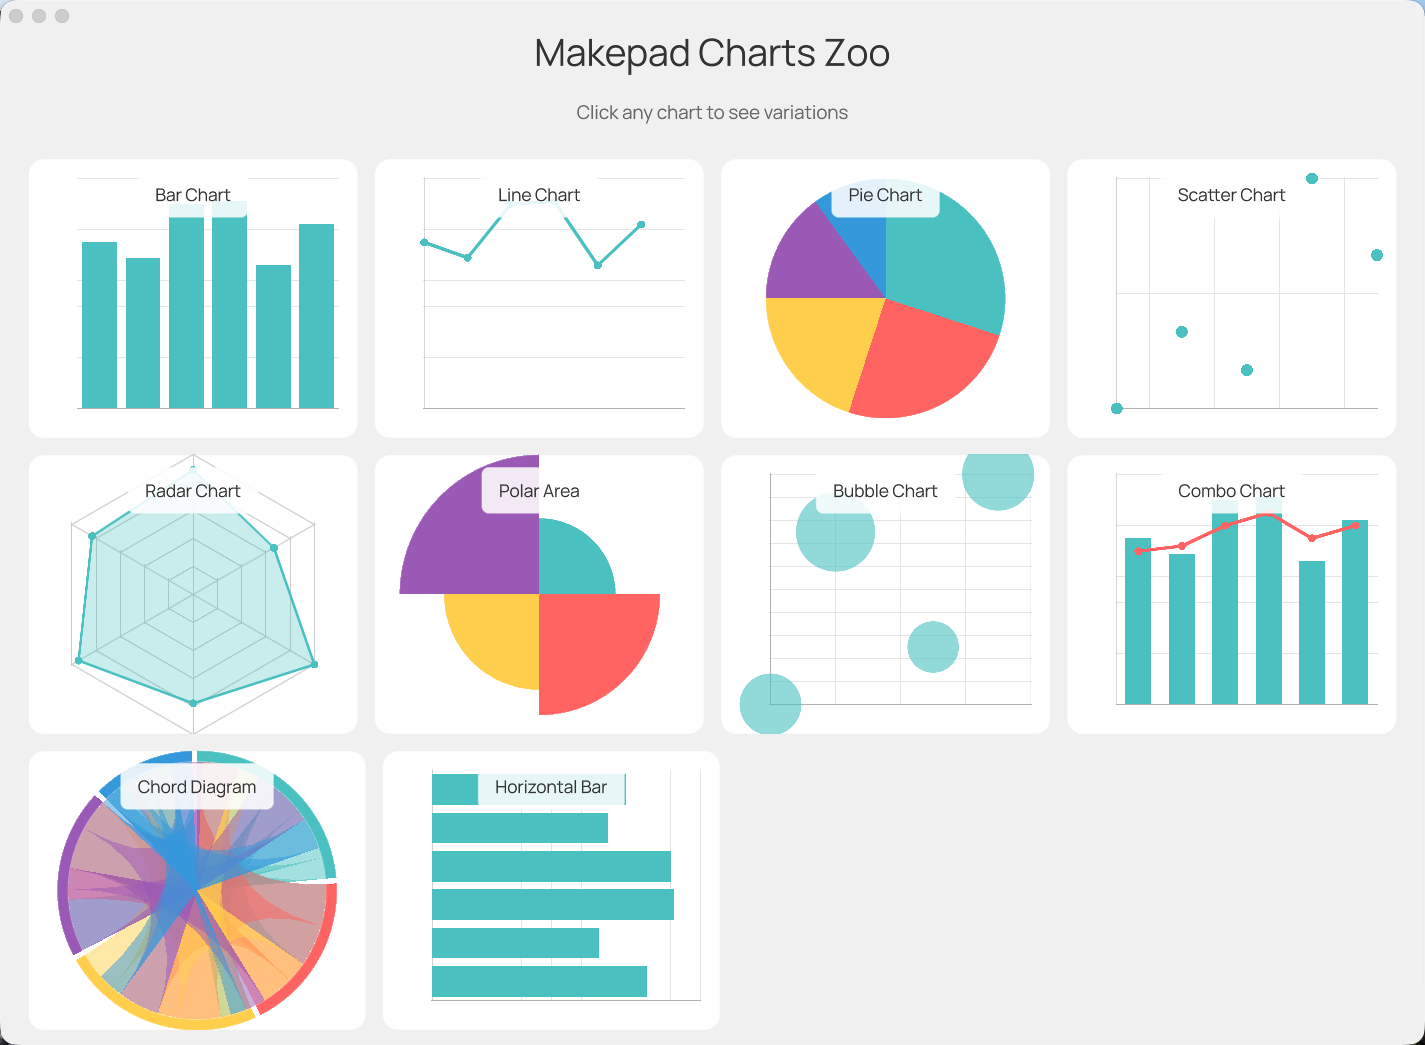
  • 11 Chart Types: Bar, Line, Pie, Doughnut, Scatter, Bubble, Radar, Polar Area, Combo, Horizontal Bar, Chord
  • GPU Accelerated: All rendering done via Makepad's GPU shader system
  • Animations: Smooth animations with 28 easing functions + delay animation + progressive animation
  • Gradients: Vertical, radial, and angular gradients for all chart types
  • Progressive Animation: Dense time-series with 1000+ points drawing left-to-right
  • Chart Overlays: Layer multiple chart types using absolute positioning
  • Multi-Dataset Colors: Color-coded datasets with custom color support
  • Interactive: Hover effects and click detection
  • Cross-Platform: Works on Desktop, Web (WASM), iOS, and Android

Run Example

1cargo run --example chart_zoo

Renderings

Chart Zoo

Installation

Add to your Cargo.toml:

1[dependencies]
2makepad-widgets = { git = "https://github.com/makepad/makepad", branch = "main" }
3makepad-charts = { git = "https://github.com/mofa-org/makepad-chart", branch = "main" }

Quick Start

1. Register the library

1impl LiveRegister for App {
2    fn live_register(cx: &mut Cx) {
3        makepad_widgets::live_design(cx);
4        makepad_charts::live_design(cx);  // Add this
5    }
6}

2. Add chart to your UI

1live_design! {
2    use link::theme::*;
3    use link::widgets::*;
4    use makepad_charts::chart::bar_chart::BarChart;
5
6    App = {{App}} {
7        ui: <Window> {
8            body = <View> {
9                my_chart = <BarChart> {
10                    width: Fill,
11                    height: 300,
12                }
13            }
14        }
15    }
16}

3. Set chart data

1use makepad_charts::*;
2use makepad_charts::chart::bar_chart::BarChart;
3
4impl App {
5    fn setup_chart(&mut self, cx: &mut Cx) {
6        let data = ChartData::new()
7            .with_labels(vec!["Jan", "Feb", "Mar", "Apr", "May", "Jun"])
8            .add_dataset(
9                Dataset::new("Sales")
10                    .with_data(vec![65.0, 59.0, 80.0, 81.0, 56.0, 72.0])
11            );
12
13        if let Some(mut chart) = self.ui.widget(id!(my_chart)).borrow_mut::<BarChart>() {
14            chart.set_data(data);
15            chart.set_options(ChartOptions::new().with_begin_at_zero(true));
16        }
17
18        self.ui.redraw(cx);
19    }
20}

Chart Types

Bar Chart

1use makepad_charts::chart::bar_chart::BarChart;
2
3// Vertical bars, supports stacked and grouped modes
4chart.set_stacked(true);  // Enable stacking
5chart.set_delay_animation(true);  // Staggered animation
6chart.set_gradient(true);  // Vertical gradient on bars

Line Chart

1use makepad_charts::chart::line_chart::{LineChart, SteppedMode};
2
3chart.set_fill(true);  // Area chart
4chart.set_stepped(SteppedMode::After);  // Stepped line
5chart.set_show_points(true);  // Show data points
6chart.set_progressive_animation(true);  // Draw left-to-right
7chart.set_gradient(true);  // Enable area gradient

Pie / Doughnut Chart

1use makepad_charts::chart::pie_chart::PieChart;
2
3chart.set_doughnut(true);  // Doughnut mode
4chart.set_radial_gradient(true);  // Enable gradient

Scatter Chart

1use makepad_charts::chart::scatter_chart::ScatterChart;
2
3let data = ChartData::new()
4    .add_dataset(
5        Dataset::new("Points")
6            .with_xy_data(vec![(1.0, 2.0), (3.0, 4.0), (5.0, 6.0)])
7    );
8
9chart.set_gradient(true);  // Radial gradient on points

Bubble Chart

1use makepad_charts::chart::bubble_chart::BubbleChart;
2
3let data = ChartData::new()
4    .add_dataset(
5        Dataset::new("Bubbles")
6            .with_bubble_data(vec![
7                (x, y, radius),  // Each point has x, y, and radius
8            ])
9    );
10
11chart.set_gradient(true);  // Radial gradient on bubbles

Radar Chart

1use makepad_charts::chart::radar_chart::RadarChart;
2
3chart.set_fill(true);
4chart.set_gradient(true);  // Radial gradient fill

Polar Area Chart

1use makepad_charts::chart::polar_area_chart::PolarAreaChart;
2// Equal-angle segments with radius based on value

Combo Chart (Bar + Line)

1use makepad_charts::chart::combo_chart::{ComboChart, DatasetType};
2
3chart.set_dataset_types(vec![DatasetType::Bar, DatasetType::Line]);

Horizontal Bar Chart

1use makepad_charts::chart::horizontal_bar_chart::HorizontalBarChart;
2// Horizontal bars with Y-axis categories

Chord Diagram

1use makepad_charts::chart::chord_chart::{ChordChart, ChordData};
2
3// Matrix-based relationship data
4let data = ChordData::new()
5    .with_labels(vec!["A", "B", "C", "D"])
6    .with_matrix(vec![
7        vec![0.0, 50.0, 30.0, 10.0],  // Flow from A to B, C, D
8        vec![20.0, 0.0, 40.0, 15.0],  // Flow from B to A, C, D
9        vec![10.0, 25.0, 0.0, 35.0],  // Flow from C to A, B, D
10        vec![5.0, 10.0, 20.0, 0.0],   // Flow from D to A, B, C
11    ]);
12
13chart.set_data(data);
14chart.set_gradient(true);      // Gradient ribbons
15chart.set_directed(true);      // Arrow-like directed ribbons
16chart.set_arc_gradient(true);  // Gradient on outer arcs
17chart.set_gap_angle(0.05);     // Gap between groups
18chart.set_arc_thickness(0.08); // Outer arc thickness

Animation

Basic Animation

All charts animate on load by default. Configure via ChartOptions:

1chart.set_options(
2    ChartOptions::new()
3        .with_animation_duration(500.0)  // ms
4        .with_animation_easing(EasingType::EaseOutQuart)
5);

Delay Animation (Staggered)

Bar charts support Chart.js-style delay animation:

1chart.set_delay_animation(true);
2chart.set_delay_timing(80.0, 40.0);  // per_index_ms, per_dataset_ms

Replay Animation

1chart.replay_animation(cx);

Progressive Animation (Dense Data)

For time-series or stock market charts with 1000+ points:

1// Enable progressive mode - draws points left-to-right
2chart.set_progressive_animation(true);
3chart.set_tension(0.1);  // Slight smoothing for dense data
4chart.set_show_points(false);  // Hide points for performance
5
6chart.set_options(ChartOptions::new()
7    .with_animation_duration(3000.0)
8    .with_animation_easing(EasingType::EaseOutCubic));

Chart Overlays

Layer multiple chart types using absolute positioning:

1live_design! {
2    ChartOverlay = <View> {
3        width: Fill, height: 500,
4
5        // Base chart (renders first, behind)
6        bubble_chart = <BubbleChart> { width: Fill, height: Fill }
7
8        // Overlay chart (renders on top)
9        scatter_chart = <ScatterChart> {
10            width: Fill, height: Fill,
11            abs_pos: vec2(0.0, 0.0)
12        }
13    }
14}

Both charts should use the same ChartOptions for axis alignment.

Gradients

All chart types support GPU-accelerated gradients:

Bar Chart - Vertical Gradient

1bar_chart.set_gradient(true);  // Bottom to top gradient

Line Chart - Area Gradient

1line_chart.set_fill(true);
2line_chart.set_gradient(true);  // Top to bottom gradient on fill

Scatter/Bubble - Radial Gradient

1scatter_chart.set_gradient(true);  // Center to edge gradient
2bubble_chart.set_gradient(true);   // Center to edge gradient

Pie/Doughnut Gradients

1pie_chart.set_radial_gradient(true);   // Inner to outer
2pie_chart.set_angular_gradient(true);  // Along the arc

Radar/Polar Area Gradients

1radar_chart.set_gradient(true);       // Center to edges
2polar_area_chart.set_gradient(true);  // Center to edges

Data Structures

ChartData

1let data = ChartData::new()
2    .with_labels(vec!["A", "B", "C"])  // X-axis labels
3    .add_dataset(dataset1)
4    .add_dataset(dataset2);

Dataset

1// Simple Y values
2Dataset::new("Label").with_data(vec![1.0, 2.0, 3.0])
3
4// X/Y pairs (scatter)
5Dataset::new("Label").with_xy_data(vec![(1.0, 2.0), (3.0, 4.0)])
6
7// Bubble data (x, y, radius)
8Dataset::new("Label").with_bubble_data(vec![(1.0, 2.0, 5.0)])
9
10// Floating bars (min, max)
11Dataset::new("Label").with_floating_data(vec![(-5.0, 10.0), (0.0, 15.0)])
12
13// Custom color
14Dataset::new("Label")
15    .with_data(vec![1.0, 2.0])
16    .with_color(vec4(0.3, 0.5, 0.9, 1.0))

Multi-Dataset Color Coding

1let data = ChartData::new()
2    .with_labels(labels)
3    .add_dataset(Dataset::new("MKPD").with_data(stock1))  // Default color
4    .add_dataset(Dataset::new("TECH").with_data(stock2)
5        .with_color(vec4(0.95, 0.5, 0.3, 1.0)))  // Orange
6    .add_dataset(Dataset::new("INDEX").with_data(stock3)
7        .with_color(vec4(0.4, 0.8, 0.5, 1.0)));  // Green

ChartOptions

1ChartOptions::new()
2    .with_begin_at_zero(true)
3    .with_animation_duration(400.0)
4    .with_animation_easing(EasingType::EaseOutQuart)